Suppose your micromouse is travelling in the maze at a steady speed. If there are breaks in the walls to left or right, and the mouse is correctly positioned you would expect the breaks to be seen every 180mm for a classic mouse.
It seems obvious to use the detected wall breaks to correct for any errors in forward motion and ensure the mouse is compensating for any forward errors.
But, what if the mouse is travelling very quickly and/or accelerating hard? Acceleration in particular will always be associated with some amount of wheel slip. The harder you accelerate, the worse it will be. Because of that slip the robot will think it has traveled further than it actually has. Braking is the same but now the robot will have slipped further than it thinks it has moved. So long as the slip is the same for both acceleration and braking, these two effects will tend to cancel each other out in a simple straight run. Things get more complicated if you are starting from rest and accelerating up to turning speed as you approach a corner. Now the robot will not have moved as far as it has calculated and you must look for a wall break to set the position of the turn more accurately.
Let’s have a look at how much the slip can affect things. Here is a graph showing the sensor record for a classic mouse moving down a passage of 8 cells. on the left is a continuous wall to keep the robot correctly oriented. On the right is a ‘comb’ – a series of perpendicular walls. The first and last cells have walls on both sides. Robot acceleration is about 10m/s/s and the maximum speed is 1m/s.
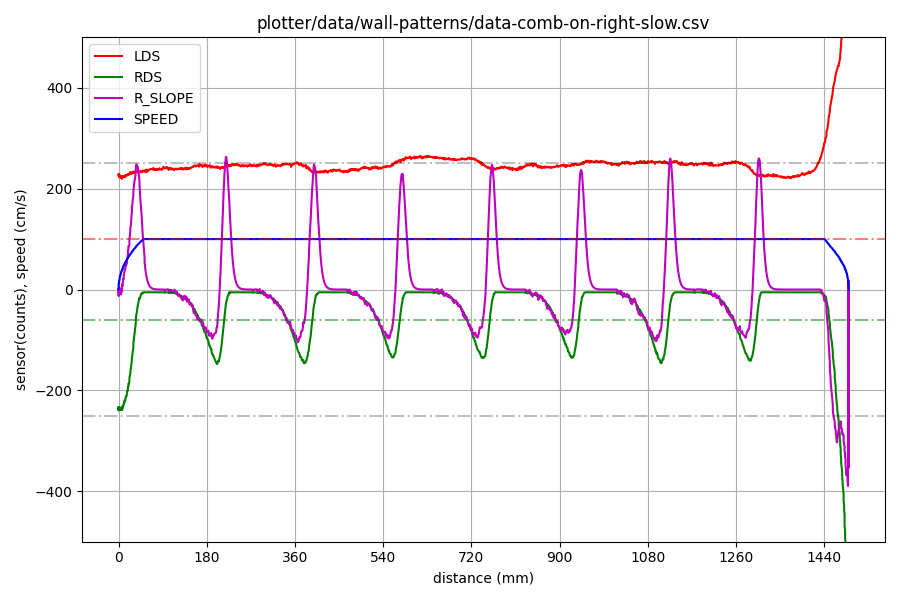
You can clearly see the right sensor (green) detecting the posts on the right. The magenta trace is a measure of the slope of the sensor trace. It can be used to detect the positions of the edges quite reliably. The robot has started with its back up against the wall so the sensor peaks are not on the 180mm grid but the distances between them are quite consistent at around 180mm. If the edge positions are tabluted for this run, this is what we get.
| position | delta |
|---|---|
| 205 | 205 |
| 383 | 178 |
| 563 | 180 |
| 747 | 184 |
| 930 | 183 |
| 1111 | 181 |
| 1293 | 182 |
| 1490 | 197 |
The first delta is larger because of the starting position and the last one is affected by the wall in the final cell. Between that, the sensed lengths of the cells is pretty consistent and acceptably accurate. If you expected much better accuracy you are probably destined for a life of misery in your micromouse endeavours. Or, of course, you are much better at this than I am. Either seems likely.
Now, what if you accelerate to the half-way point and then brake for the rest of the way. This is what you might get:
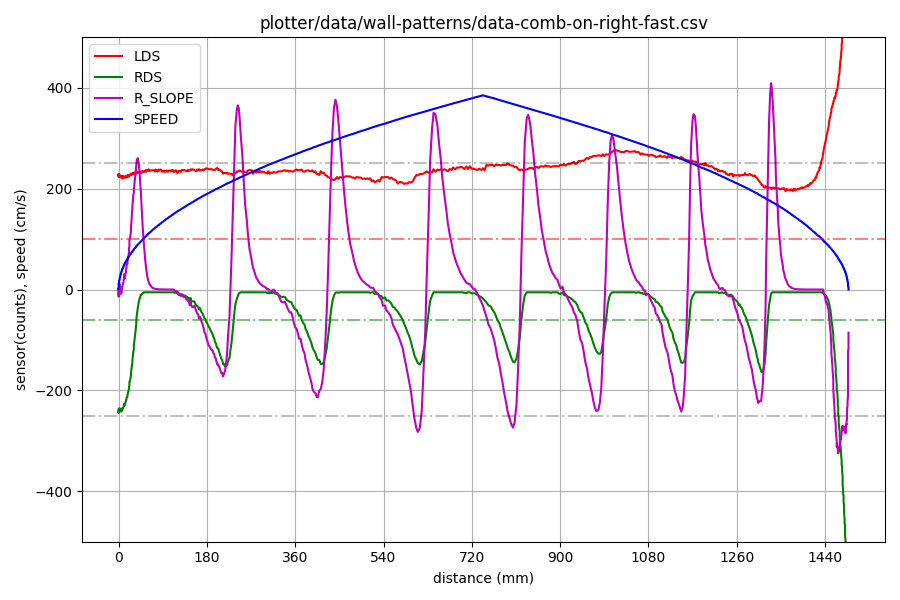
You might notice from the left sensor trace that the robot is not quite so well aligned in this run. More importantly, the right sensor trace (green) shows the posts appearing significantly later than expected. Because the robot is moving much faster, the sensor slope (magenta) values are much bigger. Top speed in this run is nearly 4m/s. Have a look at the apparent positions of the detected edges and the distance between them.
| position | delta |
|---|---|
| 228 | 228 |
| 427 | 199 |
| 628 | 201 |
| 821 | 193 |
| 994 | 173 |
| 1160 | 166 |
| 1319 | 159 |
| 1487 | 168 |
The observed cell lengths during acceleration are all greater than 180mm while those observed during braking are all smaller than 180mm. Because braking and acceleration are symmetrical at about 10m/s/s, the robot gains during braking what it loses during acceleration and you can see that the final edge in both cases is detected at about the same position.
It is up to you how you compensate for these changes in observed position due to slip. If you are confident that the effect will even out over a run, you might choose to ignore it except at the ends. If you are accelerating harder than you brake, you will always end up short of the intended position. Whatever you do, it is useful to note that every turn will have a wall/post break, or falling edge, just before it and that is the one that is most important in deciding where the turn must start.
Great post.
For a *very* long time, this issue was causing me a lot of problems because I would adjust the remaining distance. I finally figured it out when I dug deep why the mouse was entering turns at a higher speed than I wanted or why was it decelerating at a higher rate and it was because of this side affect.
In my case, during deceleration, the apparent cell distance was increasing as you described but your data doesn’t show that.
The R_SLOPE calculation is something more than a derivative because it isn’t zero when RDS is flat. And also during the RDS rising edge. Some sort of filtering.
R_SLOPE in the graph is the sum of two exponential filters on the original data. Its purpose is to detect the maximum rate of change in the sensor reading. Not in itself a reliable edge indicator but convenient to make the point in the post. Also, the filters are computationally inexpensive.
You can read more about the filters and related topics here:
http://sam-koblenski.blogspot.com/2015/09/everyday-dsp-for-programmers-edge.html